|
Joseph A
Bank Clothiers Inc. JOSB - (NASDAQ) |
|
COMPANY
|
STATS |
|
|
|
Ticker Symbol:
JOSB - Nasdaq
Industry Group:
Retail-Clothing/Shoe
Price:
$33.43
(at close 10/29/04)
Day's Volume:
364,500(at
close 10/29/04)
50-day Average Volume: :
393,400
52 Wk High: $33.43
52 WK Low: $:
$16.05
Shares Outstanding:
13.3 Million |
Shares In Float:
11.7 Million
Up/Down Volume Ratio: 1.0 Headquarters:
500 Hanover Pike
Hampstead, MD 21074
Phone: (410) 239-2700
Fax: (410) 239-5700
E-mail:
Contact
Page on Website
Website: http://www.josbank.com
|
|
|
COMPANY
|
PROFILE |
|
|
|
Profile:
Jos. A. Bank Clothiers, Inc. is a designer, retailer and direct marketer,
through stores, catalog and the Internet, of men's tailored and casual clothing
and accessories. The Company sells substantially all of its products exclusively
under the Jos. A. Bank label through its 214 retail stores, including seven
outlet stores and 10 franchise stores, located throughout 35 states and the
District of Columbia in the United States, as well as through the Company's
nationwide catalog and Internet operations, www.josbank.com. Jos. A. Bank's
products are targeted at the male career professional. The Company's products
are offered at three Levels of Luxury, which include the opening Jos. A. Bank
Collection, as well as the more luxurious Signature and Signature Gold
Collections. Strength from
other issues in the Retail-Clothing/Shoe
group and the fact the group presently ranks in the top 21% of IBD's 197
Industry Groups is a nice reassurance it is a leader in a leading group of
stocks. It has a well-established annual earnings growth record and
stellar quarterly financial reports that earn it the highest EPS rank possible.

Financials |
StockTalk
|
News
|
Chart
|
SEC
|
Zacks
Reports
|
Pivot Point |
Max Buy Price |
| $31.95 (0.10 9/22 high) |
$33.55 (PP + 5%) |
What to
Look For and Look Out For:
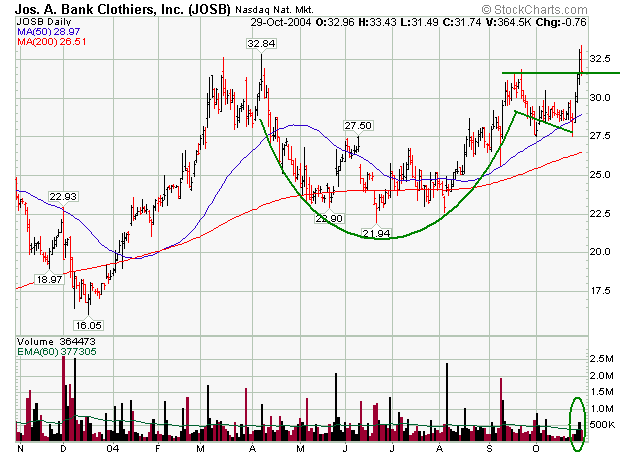
The price still needs to clear its pivot point with higher volume sufficient to satisfy the guidelines for a buyable
breakout, and the normal minimum guideline required is volume 50%+ above
average. Confirming action may come in the days ahead. However, any high volume declines that negate the recent progress and start threatening to drop near or under the 50-day
moving average line (the blue line) would make the issue less attractive as a buy candidate - and could be considered sell signals.
Technical Analysis: On August 5th it gapped up back above its 200 DMA from critical chart lows in the
$22 range, gaining on the highest volume since December. On August 19th it initially traded up above the pivot point identified in our August 22nd Special Report, however it promptly reversed to close flat, lacking the
50%+ higher than average volume needed for a good buyable breakout. It rallied in September to challenge prior chart highs in March-April, then retested support near its 50-day moving average line. All-time highs have recently been tested and exceeded, but volume should be convincing as it clears long-term chart highs.
|
|
OUR |
CANSLIM |
COMPARATIVE
|
|
|
JOSB Quarterly
Financial Comparisons Versus The Year Earlier |
| Quarter: |
10/31/03 |
01/31/04 |
04/30/04 |
07/31/04 |
| Earnings: |
0.20 vs 0.14 |
+43% |
0.68 vs 0.48 |
+42% |
0.37 vs 0.16 |
+131% |
0.25 vs 0.15 |
+67% |
| Sales
($Mil): |
72.0 vs 57.9 |
+24% |
100.9 vs 77.9 |
+30% |
79.9 vs 62.3 |
+28% |
82 vs 64.4 |
+27% |
Current
Quarterly Earnings
- The
table below shows how the past four earnings announcements
have been versus the same quarter one year earlier,
leading off with the oldest and ending with the latest
reported quarterly results. Notice how the earnings percentage
growth has been particularly strong over this period,
thoroughly exceeding the minimum 25%+ earnings
improvement that is within proper guidelines. Return
on Equity for the company has been 22%, above
O'Neil's 17% guideline in that area. Jos. A. Bank Clothiers'
underlying sales revenue increases have also been
continually
impressive.
|
JOSB - Sales Revenues |
2003 |
2004 |
%
Change |
|
Totals |
262.5 |
334.8 |
+27.5% |
|
|
|
|
Note: US $ Milllion(s) |
Annual
Earnings - When
applying CANSLIM there should be meaningful annual earnings growth over
the last three to five years. The average annual compounded growth rate of
earnings in the superior firms should be from +15% to +50% per
year or more. A review of JOSB's annual earning history shows
for the past four years show an average increase of +48.25%.
|
Year |
EPS |
%+/- |
Stock Price |
|
High |
Low |
|
1999 |
0.34 |
|
4 |
1 |
|
2000 |
0.25 |
-26.5% |
3 |
1 |
|
2001 |
0.42 |
+68.0% |
4 |
2 |
|
2002 |
0.57 |
+35.7% |
14 |
3 |
|
2003 |
0.82 |
+43.9% |
29 |
9 |
|
2004 |
1.19 |
+45.1% |
33 |
18 |
New
Highs in the Stock’s Price, New Management, New Products
Services - Jos.
A. Bank Clothiers traded up to a new 7-month high last
week and is
-5.1%
from its 52-week high. The
company manufactures classic men's clothing and has expanded its traditional sales of clothing to
include direct
marketing via catalogs throughout the United States and
also on the world wide web at www.josbank.com. Traditionally, men’s apparel has been sold in
retail stores, however, a large portion of the company's
profits
are due to its direct marketing sales. Oct. 11,
2004 the company announced that it had teamed with QVC, Inc. to establish a JoS. A. Bank "virtual" storefront on QVC's e-commerce site, QVC.com, and will offer more than 500 men's apparel and accessory items to QVC's
shoppers on the PM Style segment which airs from 8:00 PM to 10:00 PM Eastern Time.
Supply
of Stock
-
There
are 13.3 million shares outstanding and 11.7
million open in float (the number of freely traded
public shares), with the difference being the amount held by the company’s
insiders approximating 12% of the total shares
outstanding. When looking for buy candidates an important
indicator is the number of shares in the float. When stocks
have between 5 - 50 million shares in
their float they are most ripe for take off. The reason is
that when
institutional investors look to acquire stock they will
normally buy
in large amounts. When a company has billions of shares
in its float the buying demand must be absolutely tremendous in order
to have a significant movement in price. However,
the share prices can rise much faster due to the tight
supply when in demand companies have fewer than 50 million shares in
their float.
Leading
Company in a Leading Group -
Jos. A Bank is in the
Retail-Clothing/Shoe industry group and has the strongest fundamentals in
its group. Its Relative Strength rating is an impressive 89,
which means that JOSB is performing better than 89% of the stocks
making up the S&P 500 Index. This leading company has solid
fundamental characteristics and a bullish technical chart pattern. Great
reassurance comes from the fact that other companies in the group are
demonstrating similarly strong fundamental performance as well as great
technical strength in their price/volume charts. Study several of its
peers including Bebe Stores Inc (BEBE), Urban Outfitters Inc (URBN) and
American Eagle Outfitters (AEOS) as examples of additional group
leadership. It is important to choose a high-ranked leader in a part
of the market that is serving up lots of additional leadership.
While not all retail names in the market are sporting such high ranks or
showing up on the new highs list, on almost a daily basis there has been a
recognizable presence of retail issues making it to the CANSLIM.net
BreakOuts Page.
Institutional
Sponsorship - The
“I” In CANSLIM is very important because it shows what the largest
market participants with the most influence are doing. Institutions own 48% of JOSB
at present . Their large interest could have a major amount of influence
as this is a
substantial portion of the shares in its float. Be aware that this
is also a key reason to be disciplined in your selling to limit losses at 7-8%
- and especially important if fund managers were to decide to rush for
the exit door. However, another encouraging sign is
that the number of funds having an ownership interest has been generally increasing over the
past few quarters. In December 2003 there were 53 top-performing
funds owning JOSB, and that number increased to 63 funds in March 2004. In June of 2004
that number swelled to 73. As of September of 2004 the number of funds
remained virtually unchanged at 71. Overall this illustrates a
reasonably clear demand
for the stock by more institutional investors .
|
Ownership Summary
|
|
# Institutions: |
121 |
|
3 Mo. Shares Purchased: |
5,409,680 |
|
3 Mo. Shares Sold: |
(4,752,772) |
|
3 Mo. Net Change: |
656,908 |
| JOSB
- Top Institutional Holders |
| Institution
Name |
Shares
Held |
Position
Value (000) |
%
Shs. Out. |
Portfolio
Date |
| RS
INVESTMENT MANAGEMENT, INC. |
1,041,662 |
$32,697.77 |
8.01% |
6/30/2004 |
| VEREDUS
ASSET MANAGEMENT LLC |
916,368 |
$25,365.07 |
7.05% |
9/30/2004 |
| JLF
ASSET MANAGEMENT LLC |
663,656 |
$20,832.16 |
5.11% |
6/30/2004 |
| WINSLOW
CAPITAL MGMT |
662,935 |
$20,809.53 |
5.10% |
6/30/2004 |
| SENECA
CAPITAL MANAGEMENT |
633,250 |
$19,877.72 |
4.87% |
6/30/2004 |
| WASATCH
ADVISORS |
503,982 |
$15,820.00 |
3.88% |
6/30/2004 |
| AIM
CAPITAL MANAGEMENT |
487,001 |
$15,286.96 |
3.75% |
6/30/2004 |
| OPPENHEIMER
CAPITAL |
456,625 |
$14,333.46 |
3.51% |
6/30/2004 |
| PRINCIPAL
GLOBAL INVESTORS (DES MOINES) |
447,070 |
$14,033.53 |
3.44% |
6/30/2004 |
| TRUSCO
CAPITAL MANAGEMENT |
370,587 |
$11,632.73 |
2.85% |
6/30/2004 |
| BUCKINGHAM
CAPITAL MANAGEMENT |
407,136 |
$11,269.52 |
3.13% |
9/30/2004 |
| NORTHPOINTE
CAPITAL |
337,482 |
$10,593.56 |
2.60% |
6/30/2004 |
| VINIK
ASSET MANAGEMENT LP |
336,937 |
$10,576.45 |
2.59% |
6/30/2004 |
| MISSOURI
VALLEY PARTNERS INC |
331,812 |
$10,415.58 |
2.55% |
6/30/2004 |
| BARCLAYS
GLOBAL INVESTORS INTL |
331,160 |
$10,395.11 |
2.55% |
6/30/2004 |
| JOSB
- Top Buyers |
| Institution
Name |
Shares
Purchased |
Shares
Purchased Value (000) |
Shares
Held |
Portfolio
Date |
| RS
INVESTMENT MANAGEMENT, INC. + |
1,041,662 |
$32,697.77 |
1,041,662 |
6/30/2004 |
| PRINCIPAL
GLOBAL INVESTORS (DES MOINES) + |
447,070 |
$14,033.53 |
447,070 |
6/30/2004 |
| JLF
ASSET MANAGEMENT LLC |
442,626 |
$12,822.03 |
663,656 |
6/30/2004 |
| MISSOURI
VALLEY PARTNERS INC + |
331,812 |
$10,415.58 |
331,812 |
6/30/2004 |
| BROADVIEW
ADVISORS LLC |
299,250 |
$9,250.99 |
328,625 |
6/30/2004 |
| GLENHILL
CAPITAL MANAGEMENT LLC + |
250,000 |
$7,847.50 |
250,000 |
6/30/2004 |
| NICHOLAS
APPLEGATE CAPITAL MANAGEMENT + |
241,375 |
$7,576.76 |
241,375 |
6/30/2004 |
| VINIK
ASSET MANAGEMENT LP |
235,125 |
$6,886.79 |
336,937 |
6/30/2004 |
| SEB
ASSET MANAGEMENT + |
169,750 |
$5,328.45 |
169,750 |
6/30/2004 |
| NORTHPOINTE
CAPITAL |
159,086 |
$4,128.49 |
337,482 |
6/30/2004 |
| WASATCH
ADVISORS |
144,539 |
$2,793.78 |
503,982 |
6/30/2004 |
| ESSEX
INVESTMENT MGMT CO |
115,680 |
$2,656.25 |
262,788 |
9/30/2004 |
| OPPENHEIMER
CAPITAL |
133,499 |
$2,623.37 |
456,625 |
6/30/2004 |
| LANDIS
ASSOCIATES + |
81,250 |
$2,550.44 |
81,250 |
6/30/2004 |
| TRAVELERS
ASSET MANAGEMENT |
76,179 |
$2,250.55 |
105,192 |
6/30/2004 |
Market
Direction - Overall
market conditions have not created the most ideal CANSLIM buying
environment throughout most of 2004. The
markets have been trading “sideways” for most of this year. However, the
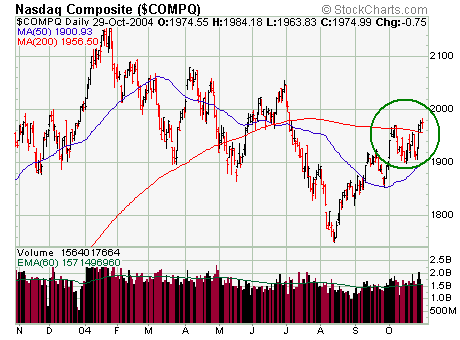
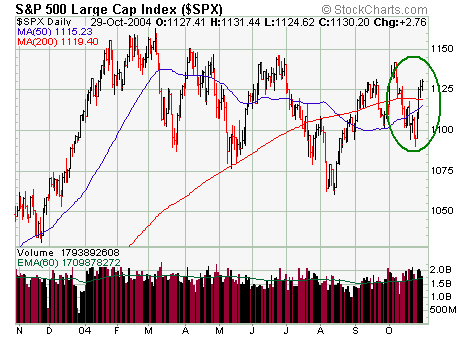
Nasdaq Composite and S&P 500 Index are now trading above their moving averages which
seems to be setting the stage for healthier action. The
S&P 500 recently charged above its 50-day and 200-day moving average lines
while volume surged to above average levels behind this meaningful
advance. This action is encouraging to see as the benchmark index rallies
toward prior highs. It topped out in the 1,142 to 1,163
range on every other occasion this year. Technical analysts are watching
to see when there will be an eventual break to the upside from its
relatively narrow range. On Friday, October 29th, 2004 there were nearly 19 stocks
rising for every 13 that fell on the NYSE, and more impressively,
there were 157 new 52-week highs and only 21 new 52-week
lows on the big board. The S&P 500 Index and Dow Industrials both
experienced their first weekly advance after declining in the three prior
weeks as they also enjoyed their fourth consecutive day of gains.


|
|
REPORT |
UPDATES |
|
|
|
Daily updates can now be found in the
CANSLIM.net After-Market Update starting Monday
11/01/04
here.
Please
let us know if you have any questions about this
stock, as we would be glad to assist you. |
This report was prepared by
Kenneth J. Gruneisen and the staff of CANSLIM.net.
If you
know someone who might find this report or the
features on our website useful, please tell them about
http://www.canslim.net/. As CANSLIM.net's
subscriber base grows we are able to offer additional resources to help you become a more successful
investor. We appreciate hearing any feedback
that you may have. Please submit any questions,
comments or suggestions
here.
Charts provided by www.stockcharts.com
unless otherwise noted.
Copyright ©
1999-2004 www.CANSLIM.net. All rights reserved.
Protected by the copyright laws of the United States and Canada
and by international treaties.
Privacy
Policy | Terms
of Use | Contact
Us
|
The material herein has been obtained from sources
believed to be reliable and accurate, however, its accuracy and
completeness cannot be guaranteed. Our firm, employees, and customers may
effect transactions, including transactions contrary to any recommendation
herein, or have positions in the securities mentioned herein or options
with respect thereto. Any recommendation contained in this report may not
be suitable for all investors and it is not to be deemed an offer or
solicitation on our part with respect to the purchase or sale of any
securities. This is an unsolicited opinion, and WWW.CANSLIM.NET. has not
been compensated in any way by the company(s) mentioned in this report.
Comments contained in the body of this report are
technical opinions only and are not necessarily those of WWW.CANSLIM.NET
The material herein has been obtained from sources believed to be reliable
and accurate, however, its accuracy and completeness cannot be guaranteed.
Our firm, employees, and customers may effect transactions, including
transactions contrary to any recommendation herein, or have positions in
the securities mentioned herein or options with respect thereto. Any
recommendation contained in this report may not be suitable for all
investors and it is not to be deemed an offer or solicitation on our part
with respect to the purchase or sale of any securities. This is an
unsolicited opinion, and WWW.CANSLIM.NET has not been compensated in any
way by the company(s) mentioned in this report.
CANSLIM.net is
independently owned and operated by WWW.CANSLIM.NET, and
is not a part of, nor in any way affiliated with either
Investor's Business Daily or William O'Neil + Co. CAN SLIM
(written here as "CANSLIM" or "Canslim:) is a registered trademark of William O'Neil + Co.
CANSLIM.net is not owned nor affiliated with William
O'Neil + Co. or any of their subsidiaries including The
Investor's Business Daily newspaper.
|
|
 Stock
Alert Report

