|
Thereís a very good chance that most of the stocks you
see presently trading at or near historic highs are
special cases worth a closer look.
And while there is no way for all of them to
continue their winning ways, a good number of them will.
In particular, the ones with strong earnings growth
trends and the ability to maintain it are top candidates
you should be considering for purchase as the market
improves.
Part of the problem is that if you wait until it is much
more obvious that the market is in a new upward trend, you
might be lured in at the wrong time, and right when it is
due for another pullback.
Worse, if you lack the confidence to enter the
market at this time, you might sit out and miss some of
the early leaders that youíll later say are just too
expensive.
But what if this is just another Bear Market rally, you
ask? Well,
that is why you must always have a sell discipline and be
willing to limit your losses and keep them small.
If the past 30 months of ugliness (the likes of
which a generation of investors has never seen) have not
helped you learn that lesson, then maybe nothing ever
will.
In the weeks ahead there are some points you should be
watching for in the major indices that should provide you
with more convincing evidence as to the marketís
direction. First,
Iíd say all bets are off if any of the major indices
nosedive through their recent lows! Hopefully we shall at least see the indices work on
establishing a series of higher lows, as I don't expect to
see the indices' recent lows taken out, at least not any
time soon or unless there were another major tragedy.
Of course, it could still happen even without
another 9-11, and one thing that is certainly odd is that
they all reached their lows on the same day, October 10,
2002. They
sure didnít top on the same day, and based on history it
would not be normal for such a unanimous bottom.
So, Iíll admit it is entirely possible for there
to be a divergence, which would confound almost everyone.
Anyhow, if you didnít note them before, here were
the recent low points for the major indices:
|
Nasdaq
Composite
|
S&P
500 Index
|
Dow
Jones Industrials
|
|
1,108.48
|
768.66
|
7,197.49
|
It is better for the present rally if the indices stay
above their respective 50-day moving average lines.
All three of the major averages are presently above
their respective 50-day moving averages, which right now
are at the following points.
A day or two below the 50-day line is one thing,
but persistent trading under it is probably a bad
indication:
|
Nasdaq
Composite
|
S&P
500 Index
|
Dow
Jones Industrials
|
|
1,268.23
|
876.76
|
8,257.16
|
Moving to the more bullish view, it becomes much more
positive for the outlook of the major indices if the
present rally manages to help the indices break above and
stay above their intermediate-term downward trend lines
(as the Dow already has) exceed their August 22nd highs
(none of them have, and it is interesting how in sync
these indices are, right?), 200-day moving averages, and
long-term downward trend lines.
In some cases youíll notice those critical points
are not very far off, while others will obviously take a
lot more time. The
point is, the case for a new Bull Market becomes much more
compelling if we see improvement above these key technical
marks for the major indices:
|
|
Nasdaq
Composite
|
S&P
500 Index
|
Dow
Jones Industrials
|
|
August
22nd high
|
1,426.75
|
964.84
|
9,077.00
|
|
Intermediate-term
line
|
1,365
|
935
|
8,260
|
|
200-day
average
|
1,563.11
|
1,011.21
|
9,346.96
|
|
Long-term
line
|
1,700
|
1,040
|
10,250
|
Hopefully, the above explanation will give you a
sufficient roadmap to help you interpret how healthy the
overall market conditions are.
Things change on a minute-by-minute basis when it
comes to individual stocks, so it is important that you to
take your clues from what you see happening in the broader
market.
On a case-by-case basis youíll find some stocks matching
up favorably with the CANSLIM criteria, of which most of
our readers have already got a grasp. Your odds of success are much greater when you choose a
leading stock in a leading group of stocks or strong
sector, as OíNeilís research shows that ďmost of the
top-performing stocks are found in the top quartile of
groups, and that group action determines at least half of
a stockís performanceĒ.
That is a direct quote from the description
accompanying IBDís 197 Industry Group Rankings.
The following list is a sampling of stocks that I find to
presently have many if not all of the right
characteristics that CANSLIM fans are looking for. The accompanying comments were added to point out things that
I feel are worth noting about these issues.
Youíll notice a good percentage of them are in
the medical group. I
left HMOs out specifically because the group has shown
numerous reversals and signs of topping.
This was recently noted in CANSLIM.netís Market
Commentary, which routinely summarizes key developments in
sectors that are standing out as particularly weak or
strong.
I hope it isnít necessary to say it, but this is not
a recommendation to run out an immediately buy these
stocks. Like
the title says, these are ďStocks to Watch in This New
MarketĒ and you should still conduct the analysis
necessary to make an informed buy and/or sell decision,
and always employ proper trading discipline including the
use of stop losses! This
can narrow your focus on some of the better ideas that are
among the most suitable purchase candidates under the
guidelines, yet they may not be suitable for all
investors.
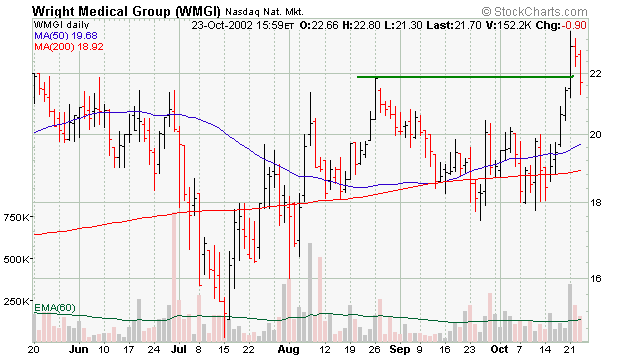
Wright
Medical Group, Inc (NasdaqNM:WMGI) has
risen clear of virtually all overhead supply and is
showing sales revenue acceleration (bigger % increases in
each successive quarterly comparison.
The stock is in a strong group, and the upcoming
earnings report (due 10/29) appears to be another very
easy comparison versus the year earlier numbers, which
could inspire more buying interest.
Although it is lacking in terms of its annual
history, this is certainly a new leader to consider for
purchase.
|
Quarterly
Comparisons Versus The Year Earlier
|
| Quarter: |
9/30/01 |
12/31/01 |
3/31/02 |
6/30/02 |
| Earnings: |
-0.04
vs -0.74 |
N/A |
0.07
vs -0.43 |
N/A |
0.13
vs 0.01 |
+999% |
0.15
vs -0.06 |
N/A |
| Sales
($Mil): |
39.1
vs 36.6 |
+7% |
46.2
vs 39.8 |
+16% |
51.7
vs 45.3 |
+14% |
50.8
vs 42.4 |
+20% |
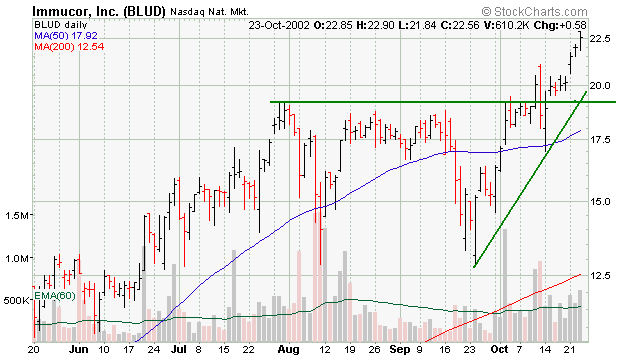
Immucor, Inc. (NasdaqNM:BLUD) is up substantially from January, when it was featured in the "Ideas Worth a Closer Look" column. Through August/September it completed a bullish "double bottom" pattern and subsequently broke out again. Many of the big winners just keep on going while most people stare in disbelief and say it too late. BLUD could still have a substantial rise ahead, but it is very important to not chase this stock too far extended above its 50-day moving average ($17.78). A stop loss is critical to protect against any severe drop on profit taking, or worse, any unexpected bad news. As it approaches its next quarterly report (due 12/21) the price action may give early clues as to the outlook.
| Quarterly
Comparisons Versus The Year Earlier |
| Quarter: |
11/30/01 |
2/28/02 |
5/31/02 |
8/31/02 |
| Earnings: |
0.30
vs -0.08 |
N/A |
0.32
vs -0.80 |
N/A |
0.34
vs -0.19 |
N/A |
0.23
vs 0.11 |
+109% |
| Sales
($Mil): |
20.90
vs 16.80 |
+24% |
21.1
vs 16.9 |
+25% |
23.5
vs 18.7 |
+26% |
23.2
vs 18.6 |
+25% |
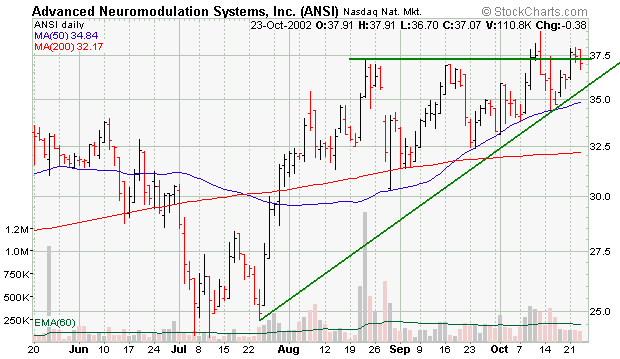
Advanced Neuromodulation (NasdaqNM:ANSI) shows accelerating sales revenues, and more importantly, solid earnings increases over the prior year. The small supply of shares outstanding (11.7 million) is a factor that could make for significant price appreciation if it continues on its current path, while average trading volume of 243,000 shares provides a fair amount of liquidity. Again we see sales acceleration, solid earnings increases, and what appears to be a very easy comparison in the upcoming quarterly report (due 10/25).
| Quarterly
Comparisons Versus The Year Earlier |
| Quarter: |
9/30/02 |
10/31/01 |
3/31/02 |
6/30/02 |
| Earnings: |
0.05 vs
0.02 |
+150% |
0.07 vs
0.01 |
+600% |
0.08 vs
0.05 |
+60% |
0.13 vs
0.05 |
+160% |
| Sales
($Mil): |
9.9 vs
8.2 |
+21% |
10.5 vs
7.9 |
+33% |
11.5 vs
8.3 |
+38% |
13.4 vs
9.2 |
+46% |
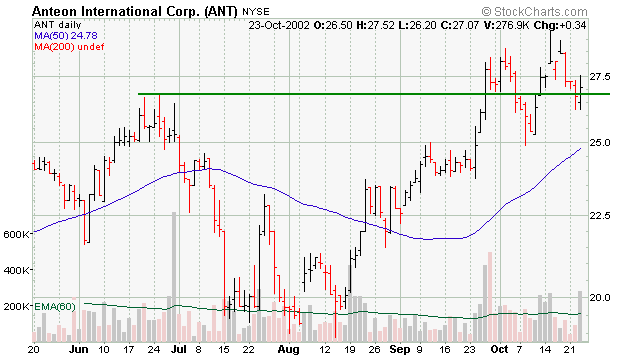
Anteon International Corp (NYSE:ANT) broke out in late September, and was featured in the "Ideas Worth a Closer Look" section in CANSLIM.net News. Since then it dipped but stayed well above its 50-day moving average, then jumped to new highs accompanies with high trading volume. The company has shown a huge earnings improvement in the quarterly reports since going public in March of this year. One concern is decelerating sales revenue growth over the sequence of quarterly reports. Watch from the upcoming announcement (due 10/28).
| Quarterly Comparisons Versus
The Year Earlier |
| Quarter: |
9/30/01 |
12/31/01 |
3/31/02 |
6/30/02 |
| Earnings: |
0.13 vs
-0.07 |
N/A |
-0.13 vs
-0.08 |
N/A |
0.19 vs
-0.03 |
N/A |
0.21 vs
-0.02 |
N/A |
| Sales
($Mil): |
183.7 vs
134.1 |
+37% |
180.2 vs
152.7 |
+18% |
192.6 vs
162.4 |
+19% |
201.9 vs
188.8 |
+7% |
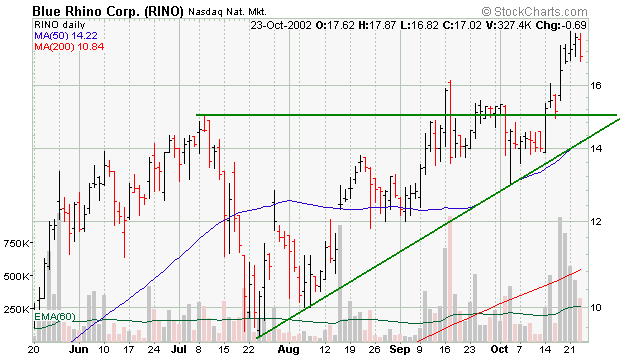
Blue Rhino Corporation (NasdaqNM:RINO) new requirements from the Federal government have made it necessary for the valves on propane tank cylinders (common on BBQ grills) to meet a new standard. This is proving to substantially benefit the company as sales and earnings improvements over the year earlier have been substantial. A previous breakout above $15 on 9/16 promptly reversed on 9/17, but the stock remained above its 50-day moving average and in the past week has repeatedly seen its way to new highs on above average volume.
| Quarterly Comparisons Versus
The Year Earlier |
| Quarter: |
10/31/01 |
1/21/02 |
4/30/02 |
7/31/02 |
| Earnings: |
0.01 vs
-0.03 |
N/A |
-0.06 vs
-0.22 |
N/A |
0.12 vs
-0.19 |
N/A |
0.40 vs
0.05 |
+700% |
| Sales
($Mil): |
36.5 vs
33.6 |
+9% |
38.8 vs
31.5 |
+23% |
58.9 vs
31.3 |
+88% |
71.3 vs
41.6 |
+72% |
Bunge
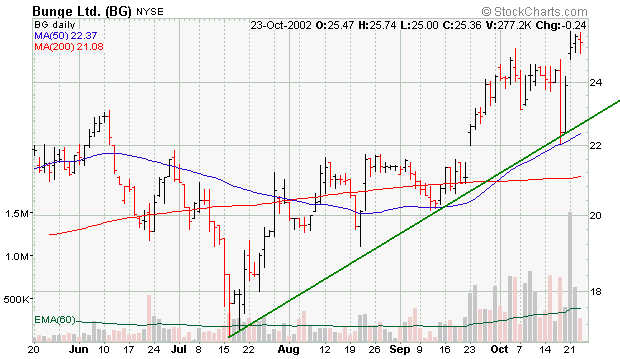
Limited (NYSE:BG) gapped up and hit new highs on more than four times average volume on 10/21, clearing a 10-month base. Although earnings announced on 10/21 were up 26% over the year earlier quarter, IBD sliced its EPS rating to below the 80 level we normally use as a guideline for CANSLIM (not the first time one might take issue with their ranking method). There are a number of agriculture/food stocks showing strength, and while IBD's Food-Dairy Products group is ranked #2 of 197 Industry Groups, the Agricultural Operations group has moved up from 79th on the list to 20th over the past three months.
| Quarterly Comparisons Versus
The Year Earlier |
| Quarter: |
12/31/01 |
3/31/02 |
6/30/02 |
9/30/02 |
| Earnings: |
0.58 vs
0.17 |
+241% |
0.42 vs
-0.06 |
N/A |
0.50 vs
0.36 |
+39% |
0.96 vs
0.76 |
+26% |
| Sales
($Mil): |
3172.0 vs
2667.0 |
+19% |
2684.0 vs
2472.0 |
+9% |
3103.0 vs
2689.0 |
+15% |
3603.0 vs
3151.0 |
+14% |
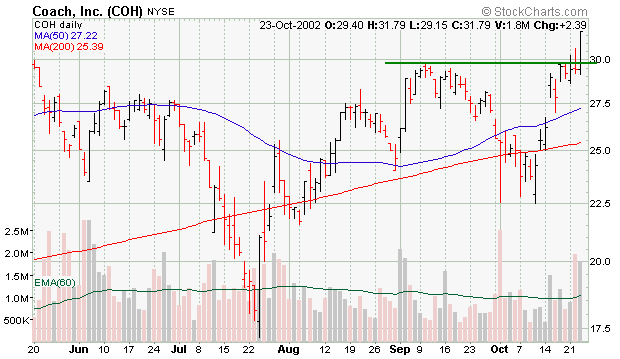
Coach, Inc. (NYSE:COH) has shown impressive sales strength, and earnings comparisons have been up in the 70-80% range over the year earlier in the past three quarterly reports. A gap up on 10/15 allowed the stock to get back above its 50-day moving average and it has since managed to reach new highs. A number of Retail-Apparel issues are providing confirmation of strength in the group. COH has a great annual earnings growth history, demonstrating the kind of impressive track record we look for.
| Quarterly Comparisons Versus
The Year Earlier |
| Quarter: |
12/21/01 |
3/31/02 |
6/30/02 |
9/30/02 |
| Earnings: |
0.49 vs
0.44 |
+11% |
0.16 vs
0.09 |
+78% |
0.18 vs
0.10 |
+80% |
0.24 vs
0.14 |
+71% |
| Sales
($Mil): |
235.8 vs
211.0 |
+12% |
161.6 vs
125.7 |
+29% |
171.4 vs
132.3 |
+30% |
192.8 vs
150.7 |
+28% |
DENTSPLY
International In (NasdaqNM:XRAY)
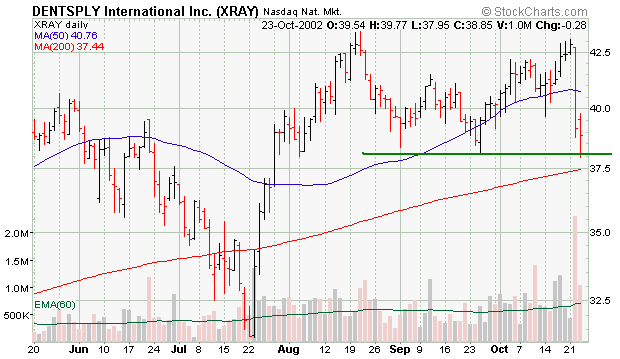
recovered very quickly from the July lows which briefly took it below its 200-day average. It was no doubt the result of major institutional support that it zoomed to new highs less than a month later, showing up as an early leader in the medical group. It found support at its 50-day average line while consolidating over the past eight weeks, however it sold off on high volume as it announced its latest quarterly results (10/22). The action is actually quite common even among healthy stocks when earnings are announced, while it does at least leave a question mark behind a company that has an excellent annual and quarterly earnings track record! More weakness below prior lows and its 200-day average ($37.41) would be of greater concern, otherwise this might be worthy of consideration.
| Quarterly Comparisons Versus
The Year Earlier |
| Quarter: |
9/30/01 |
12/31/01 |
3/31/02 |
6/30/02 |
| Earnings: |
0.33 vs
0.29 |
+14% |
0.41 vs
0.40 |
+3% |
0.40 vs
0.31 |
+29 |
0.46 vs
0.35 |
+31% |
| Sales
($Mil): |
253.5 vs
216.7 |
+17% |
375.3 vs
234.4 |
+60% |
351.2 vs
245.7 |
+43% |
378.0 vs
254.6 |
+48% |
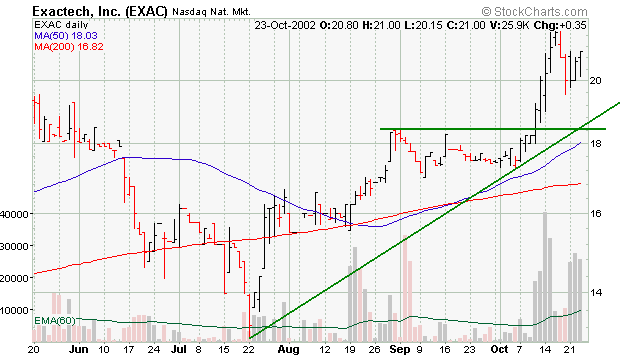
Exactech, Inc. (NasdaqNM:EXAC) is clearly a thin trading issue (avg about 10,000 daily), but it is difficult to ignore a breakout in the strong Medical-products group with such high ranks. It has a respectable annual earnings history and is touching up against all time highs as it completes the right side of a near 2-year base. Only 2.48 million shares are in the public float, and that might have to change in order for more institutional players to take interest. A secondary offering would not be very far out of the question in the future, and while that hypothetic scenario might put the brakes on upward progress for the short-term, it would be a key step in its maturing through a rapid-growth adolescent phase into adulthood.
| Quarterly Comparisons Versus
The Year Earlier |
| Quarter: |
12/31/01 |
3/31/02 |
6/30/02 |
9/30/02 |
| Earnings: |
0.23 vs
0.22 |
+5% |
0.22 vs
0.19 |
+16% |
0.22 vs
0.15 |
+47% |
0.24 vs
0.20 |
+20% |
| Sales
($Mil): |
12.0 vs
10.9 |
+10% |
13.8 vs
11.6 |
+19% |
15.0 vs
11.8 |
+27% |
14.5 vs
11.3 |
+29% |
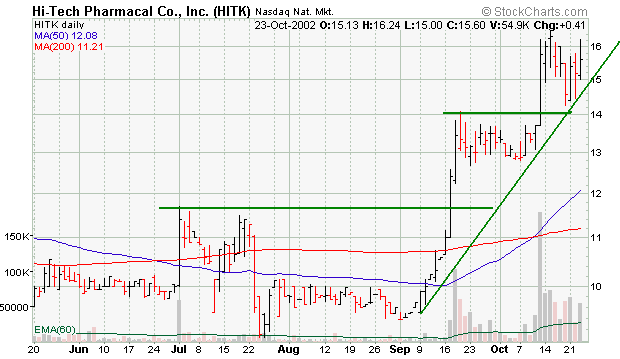
Hi-Tech Pharmacal Co. (NasdaqNM:HITK) has managed a steep sprint higher in the past six weeks, however its impressive trend of sales revenue acceleration and very large earnings increase in the latest quarter do help to justify such a move in a company with only 4.78 million shares outstanding. Annual earnings have climbed from $0.38 in 2000, to $0.54 in 2001, to $0.71 in 2002, setting a solid pace for this generic drug maker. President Bush has inspired strength in the sector with a recent proposal to speed generic drugs to market.
| Quarterly Comparisons Versus
The Year Earlier |
| Quarter: |
10/31/01 |
1/31/02 |
04/31/02 |
07/31/02 |
| Earnings: |
0.18 vs
0.12 |
+50% |
0.20 vs
0.15 |
+33% |
0.23 vs
0.21 |
+10% |
0.19
vs 0.10 |
+90% |
| Sales
($Mil): |
8.4
vs 7.9 |
+7% |
9.3
vs 8.8 |
+6% |
9.6
vs 7.9 |
+21% |
8.8 vs
5.9 |
+50% |
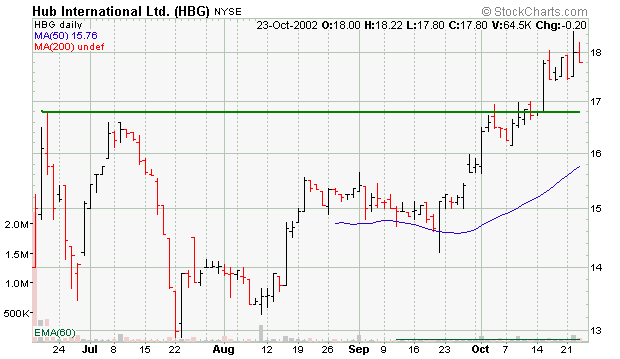
Hub International Limited (NYSE:HBG) is another strong performer in the insurance sector. It features solid sales revenue growth and impressive earnings comparisons versus the prior year. It recently broke to new highs after basing for more than 4 months. The number of mutual funds with an ownership interest rose from 9 funds in December of 2001 to 42 funds in September 2002. Prior to the breakout it found good support at it's 50-day moving average. No resistance stands in the way of higher prices.
| Quarterly Comparisons Versus
The Year Earlier |
| Quarter: |
9/30/01 |
12/31/01 |
3/31/02 |
6/30/02 |
| Earnings: |
0.09 vs
0.06 |
+50% |
0.14 vs
0.03 |
+367% |
0.21 vs
0.17 |
+24% |
0.32 vs
0.18 |
+78% |
| Sales
($Mil): |
43.6 vs
24.5 |
+78% |
53.0 vs
24.5 |
+117% |
49.5 vs
28.1 |
+76% |
57.3 vs
29.3 |
+95% |
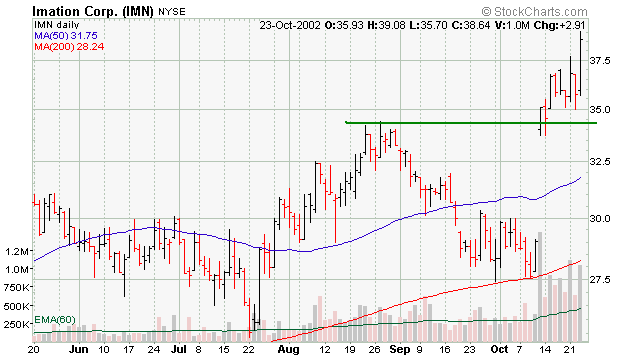
Imation Corp. (NYSE:IMN) gapped up to new highs on 10/11 with volume more than three times normal. Earnings comparisons have been strong in the latest reports, but total sales are bit less than flat. The company has eliminated some parts of its business that were less profitable to focus exclusively on the data storage market. It sees an optimistic outlook, however is seems as though there are not many other companies in the data storage group showing confirming strength.
| Quarterly Comparisons Versus
The Year Earlier |
| Quarter: |
12/31/01 |
3/31/02 |
6/30/02 |
9/30/02 |
| Earnings: |
-0.65 vs
0.43 |
N/A |
0.45 vs
0.11 |
+309% |
0.41 vs
0.26 |
+58% |
0.46 vs
0.26 |
+77% |
| Sales
($Mil): |
299.8 vs
308.5 |
-3% |
270.6 vs
284.6 |
-5% |
261.4
vs 269.3 |
-3% |
263.8 vs
265.6 |
-1% |
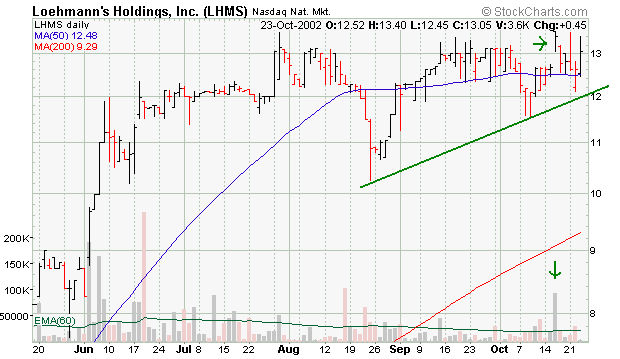
Loehmanns Holdings, Inc. (NasdaqNM:LHMS) shows a nice turnaround in sales revenues and solid earnings growth over the past several quarterly reports. Insiders have shown a serious vote of confidence by purchasing over $1 million worth of stock reported in the past two months, while the stock has been perched up at historic highs and building a base. It has established a solid uptrend and has recently poked up to new highs on above normal volume. After a 2/1 split it still has only 4.4 million shares in the public float.
| Quarterly Comparisons Versus
The Year Earlier |
| Quarter: |
10/31/01 |
1/31/02 |
4/30/02 |
7/31/02 |
| Earnings: |
0.42 vs
1.05 |
-60% |
0.47 vs
0.07 |
+571% |
0.60 vs
0.38 |
+58% |
0.03 vs
-0.22 |
N/A |
| Sales
($Mil): |
83.7 vs
88.6 |
-6% |
84.2 vs
86.6 |
-3% |
93.4 vs
87.8 |
+6% |
75.3 vs
66.9 |
+13% |
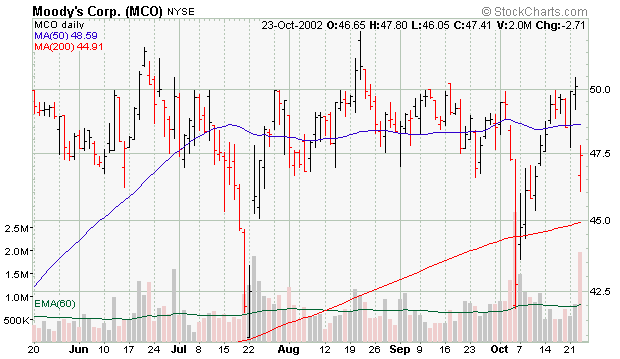
Moody's Corporation (NYSE:MCO) continues to put up solid sales and earnings while zigzagging between the low 40's and low 50's over the past 6 months. It has high ranks and is known to be among Warren Buffett's current favorites. With 155 million shares outstanding it is a bit on the big side for CANSLIM fans, however it clearly has strong institutional appeal. Cautious remarks about the coming year added to the usual selling pressure that accompanied its 10/22 earnings announcement. Still, the company expects double digit percentage growth and is truly a leader in its class.
| Quarterly Comparisons Versus
The Year Earlier |
| Quarter: |
9/30/01 |
12/31/02 |
3/31/02 |
6/30/02 |
| Earnings: |
0.31 vs
0.25 |
+24% |
0.37
vs 0.25 |
+48% |
0.46
vs 0.30 |
+53% |
0.49 vs
0.34 |
+44% |
| Sales
($Mil): |
190.4 vs
152.5 |
+25% |
220.9
vs 161.1 |
+37% |
231.6 vs
180.2 |
+29% |
271.5 vs
205.2 |
+32% |
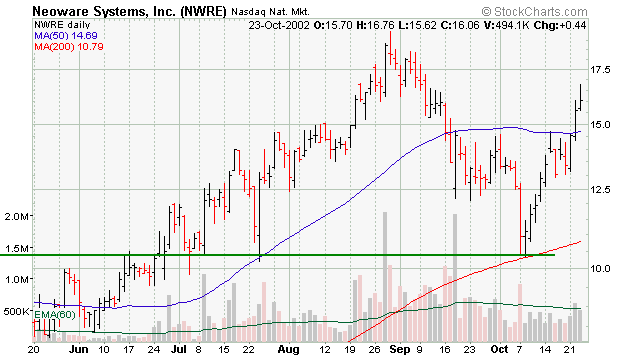
Neoware Systems, Inc. (NasdaqNM:NWRE) made a great run after featured in July's "Ideas Worth a Closer Look" section, rising more than 70% in two months, but then gave the whole move back in less than six weeks. Interestingly, and not unlike charts we often see, NWRE found support right at the 200-day moving average line, which also coincided nicely with earlier highs in April. That old resistance level became the new support level. Sales revenue and earnings increases have been in very large percentages, and it seems to be coming up against an easy to beat year earlier number again when it announces results (due 10/29).
| Quarterly Comparisons Versus
The Year Earlier |
| Quarter: |
9/30/01 |
12/31/01 |
3/31/02 |
6/30/02 |
| Earnings: |
0.02 vs
-0.01 |
N/A |
0.06 vs
-0.03 |
N/A |
0.06 vs
0.03 |
+100% |
0.13 vs
0.05 |
+160% |
| Sales
($Mil): |
5.3
vs 4.0 |
+31% |
6.6 vs
3.4 |
+95% |
8.4 vs
4.9 |
+70% |
14.1 vs
5.3 |
+165% |
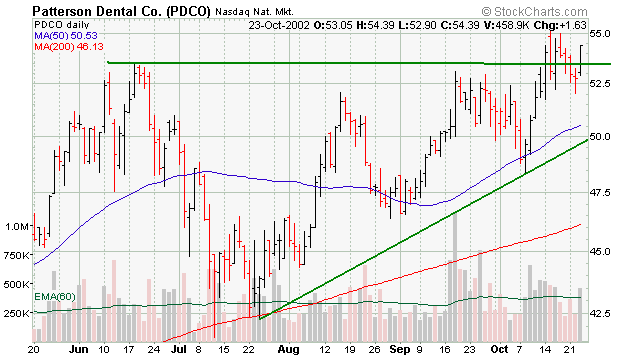
Patterson Dental Company (NasdaqNM:PDCO) features strong sales and earnings growth trends and a great annual earnings history. It recently broke out of a 4-month base that has a cup-with-handle pattern. Actually, it formed an additional handle and found persistent support at its 50-day average. If you are looking for stock charts that show a series of higher lows, this is a perfect example. The 68.2 million shares outstanding is a bit large, but not a serious deterrent to buying when considering all other factors which are so compelling.
| Quarterly Comparisons Versus
The Year Earlier |
| Quarter: |
10/31/01 |
1/31/02 |
4/30/02 |
7/31/02 |
| Earnings: |
0.34 vs
0.28 |
+21% |
0.36 vs
0.30 |
+20% |
0.40 vs
0.31 |
+29% |
0.37 vs
0.29 |
+28% |
| Sales
($Mil): |
355.0 vs
290.70 |
+22% |
357.4 vs
290.6 |
+23% |
399.9
vs 305.1 |
+31% |
387.7 vs
303.3 |
+28% |
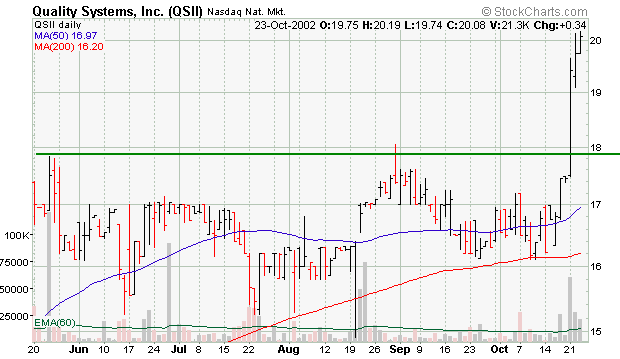
Quality Systems, Inc. (NasdaqNM:QSII) makes systems that automate medical and dental group practices, which is adjacent to the strong medical group. It broke out on 10/21 with volume 6 times above average, but it only averages about 10,000 shares per day and has just 3.31 million shares in the public float. It's annual earnings growth trend is excellent, with earnings of $0.09 per share in fiscal 1999, $0.40 in 2000, $0.63 in 2001, and $0.84 in 2002.
| Quarterly Comparisons Versus
The Year Earlier |
| Quarter: |
9/30/01 |
12/31/01 |
3/31/02 |
6/30/02 |
| Earnings: |
0.18 vs
0.13 |
+38% |
0.22 vs
0.17 |
+29% |
0.24 vs
0.21 |
+14% |
0.26 vs
0.20 |
+30% |
| Sales
($Mil): |
10.5
vs 9.7 |
+9% |
11.0 vs
10.3 |
+7% |
12.0 vs
10.7 |
+12% |
12.3 vs
10.9 |
+13% |
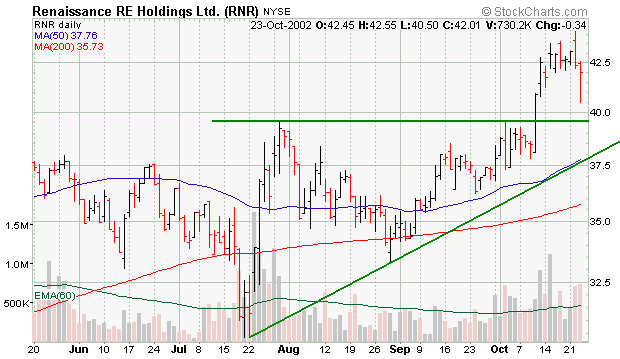
RenaissanceRe Holdings (NYSE:RNR) broke out recently from a long base where it had met persistent resistance near $40. Three weeks in a row have featured above average volume along with the advance to new highs. Quarterly comparisons are showing bigger % increases in sales revenues and earnings over the past 5 reports. Confirmation is also provided by a number of other stocks in the insurance sector, which is an important factor to have in your favor. The latest earnings announcement (10/22) was met with heavy selling, which again is a normal thing to see even when the numbers are good.
| Quarterly Comparisons Versus
The Year Earlier |
| Quarter: |
9/30/01 |
12/31/01 |
3/31/02 |
6/30/02 |
| Earnings: |
0.41 vs
0.58 |
-29% |
0.69 vs
0.60 |
+15% |
1.24 vs
0.61 |
+103% |
1.33 vs
0.62 |
+115% |
| Sales
($Mil): |
103.7 vs
99.4 |
+4% |
123.4 vs
104.9 |
+18% |
180.0
vs 113.0 |
+59% |
225.9 vs
100.8 |
+124% |
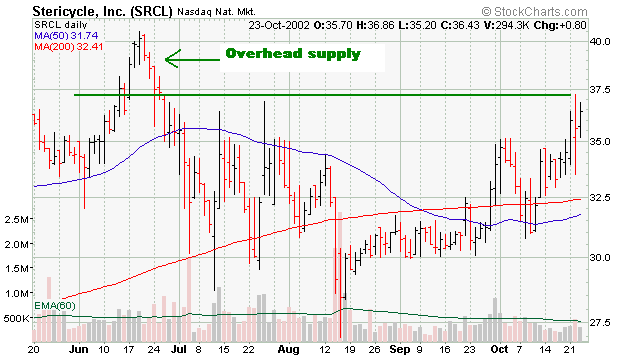
Stericycle, Inc. (NasdaqNM:SRCL) is involved with medical waste management, which goes along rather nicely with the strength in the medical sector. While it is 12% off its June high it maintains high ranks and has a stellar annual earnings history. Little resistance remains in the way, and mutual funds have clearly been showing a greater interest. The number of funds holding an interest has risen from 109 funds in September of 2001, to 160 funds as of June of 2002. Since bottoming in August it has advanced in 8 of the past 9 weeks.
| Quarterly Comparisons Versus
The Year Earlier |
| Quarter: |
9/30/01 |
12/31/01 |
3/31/02 |
06/31/02 |
| Earnings: |
0.15 vs
0.11 |
+36% |
0.17 vs
0.13 |
+31% |
0.24
vs 0.15 |
+60% |
0.26
vs 0.19 |
+37% |
| Sales
($Mil): |
91.3 vs
81.1 |
+13% |
93.4 vs
85.4 |
+9% |
97.1 vs
85.8 |
+13% |
99.3 vs
88.6 |
+12% |
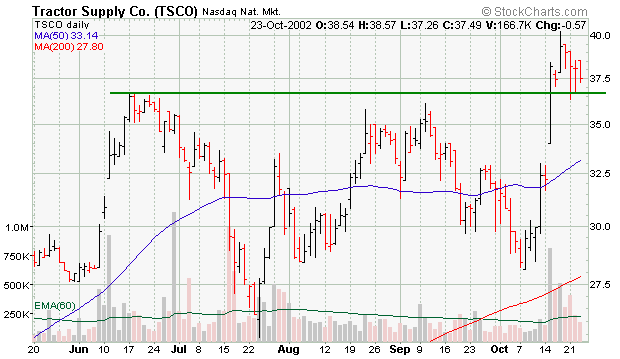
Tractor Supply Company (NasdaqNM:TSCO) gapped higher and broke out of a 4-month base on 10/15 with more than 4 times average volume after it announced another strong quarterly report. The retailer of farm equipment and supplies maintains high ranks and has only 13 million shares in the public float. It has managed a respectable advance over the past two years, while most of the market has suffered. Where many beaten down issues would obviously face selling pressure, TSCO has no "overhead supply" or resistance left to plow through, so it could easily continue to advance.
| Quarterly Comparisons Versus
The Year Earlier |
| Quarter: |
12/31/01 |
3/31/02 |
6/30/02 |
9/30/02 |
| Earnings: |
0.38 vs
0.33 |
+15% |
-0.23 vs
-0.11 |
N/A |
0.88 vs
0.76 |
+16% |
0.39 vs
0.13 |
+200% |
| Sales
($Mil): |
220.4 vs
203.7 |
+8% |
193.8
vs 162.5 |
+19% |
392.0
vs 267.5 |
+47% |
296.20 vs
199.4 |
+49% |
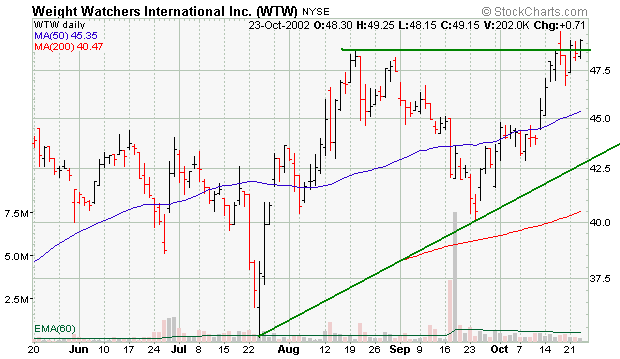
Weight Watcher's Int'l (NYSE:WTW) has zigged and zagged and zigged again since being featured in August's "Ideas Worth a Closer Look" section. A secondary stock offering on 9/17 seems to have only temporarily halted the upward price progress, and it has actually managed to make new highs in the past week. The upcoming earnings announcement (due 10/28) appears to be another relatively easy comparison versus the year earlier numbers, and it has been showing big enough percentage increases in earnings to justify a very meaningful rise in share price.
| Quarterly Comparisons Versus
The Year Earlier |
| Quarter: |
9/30/01 |
12/31/01 |
3/31/02 |
6/30/02 |
| Earnings: |
0.14 vs
0.09 |
+56% |
0.09 vs
-0.09 |
N/A |
0.34 vs
0.20 |
+70% |
0.38 vs
0.23 |
+65% |
| Sales
($Mil): |
144.1 vs
107.6 |
+34% |
145.5 vs
62.5 |
+133% |
212.5 vs
172.0 |
+24% |
217.9 vs
162.3 |
+34% |
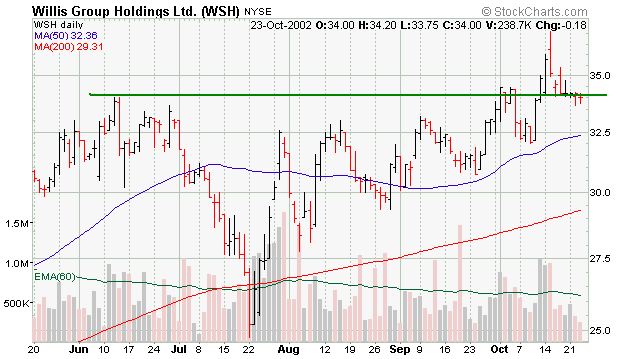
Willis Group Holdings Ltd (NYSE:WSH) has been showing excellent earnings growth (big percentages) in quarterly reports since its IPO in June of 2001. A second stock offering in May of this year demonstrates how WSH has found great support from investment bankers at a time when there have clearly been fewer stock offerings, which is somewhat of a testament to the company's fundamental strength. Its 147.6 million shares outstanding is on the large side compared to most of O'Neil's CANSLIM examples, however the company is obviously attractive to mutual fund managers. The number of funds with an ownership interest rose from 104 funds in December of 2001 to 178 funds in September of 2002.
| Quarterly
Comparisons Versus The Year Earlier |
| Quarter: |
9/30/02 |
12/31/01 |
3/31/02 |
6/30/02 |
| Earnings: |
0.16 vs
0.05 |
+220% |
0.30
vs 0.15 |
+100% |
0.52
vs 0.36 |
+44% |
0.35
vs 0.18 |
+94% |
| Sales
($Mil): |
325.0 vs
293.0 |
+11 |
387.0
vs 349.0 |
+11% |
451.0
vs 375.0 |
+20% |
411.0
vs 337.0 |
+22% |
Please let us know if you have any questions about
these stocks, as we would
be glad to assist you.
Downloadable
Portfolios
All these stocks
are available in a downloadable portfolio in either MS Excel
or a simple text file that you can easily import into your
trading or quote software
Further information is
available upon request. To request a complete shareholders package on
anyone of these companies, or if you know anyone that may have
an interest in receiving any of our other alerts, or
our monthly newsletter, CANSLIM.net News, please
email: customercare@canslim.net
or call 1-800-965-8307.
Receive a Detailed Report on Any of These Companies
Want to see a CANSLIM.net Stock Report on any other company? You can receive a complete detailed report on your stock for $59.95. Send email to
customercare@canslim.net or call 1-800-965-8307 for further assistance.
*****************************************
The material herein has been obtained from sources believed to be reliable and accurate, however, its accuracy and completeness cannot be guaranteed. Our firm, employees, and customers may effect transactions, including transactions contrary to any recommendation herein, or have positions in the securities mentioned herein or options with respect thereto. Any recommendation contained in this report may not be suitable for all investors and it is not to be deemed an offer or solicitation on our part
with respect to the purchase or sale of any securities. This is an unsolicited opinion, and CANSLIM.net, Inc. has not been compensated in any way by the company(s) mentioned in this report.
Comments contained in the body of this report are
technical opinions only and are not necessarily those of
CANSLIM.net, Inc. The material herein has been
obtained from sources believed to be reliable and
accurate, however, its accuracy and completeness cannot be
guaranteed. Our firm, employees, and customers may effect
transactions, including transactions contrary to any
recommendation herein, or have positions in the securities
mentioned herein or options with respect thereto.
Any recommendation contained in this report may not be
suitable for all investors and it is not to be deemed an
offer or solicitation on our part with respect to the
purchase or sale of any securities. This is an
unsolicited opinion, and CANSLIM.net, Inc. has not been
compensated in any way by the company(s) mentioned in this
report.
|