Wednesday, October 28, 2009 - CANSLIM.net
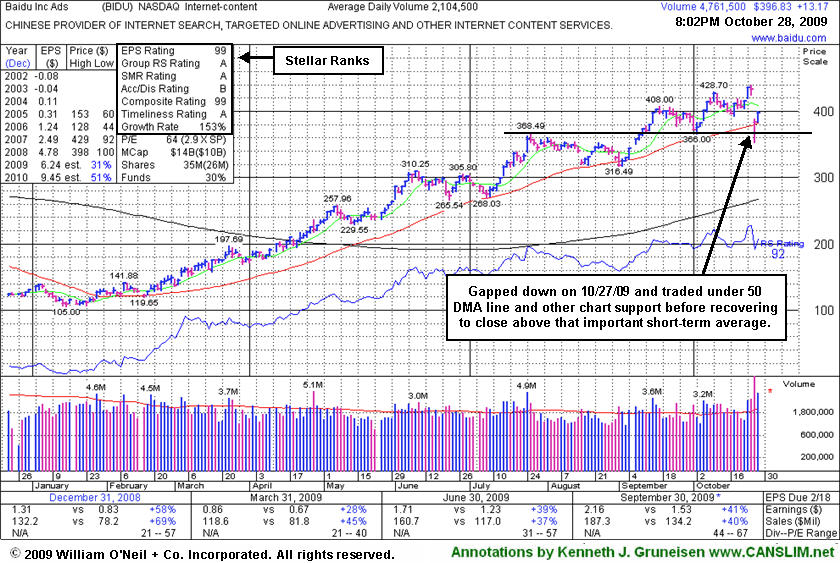
Baidu.com, Inc. (BIDU +$13.17 or +3.21% to $396.83) bucked the market's widespread weakness today, posting a gain while rallying up from its 50-day moving average (DMA) line where it has found impressive and prompt support. Volume spiked to 5 times normal on 10/27/09 as it gapped down for a considerable loss following its latest earnings report, yet it rallied back from extreme lows below its 50 DMA line and other chart support to close just above its important short term average near the session high. However, whenever a stock which has made a many-fold run up in price flashes its largest point loss on the highest volume down day in more than 10 months, such clearly negative action may be considered a technical sell signal. As recently noted, "Choppy action has not allowed it to form a sound base in recent weeks." BIDU traded up as much as +23% from its price when featured in yellow in the 9/08/09 Mid-Day BreakOuts Report (read here). Broader market (M criteria) weakness and distributional pressure now weighing on many leading issues is an increasing concern, since 3 out of 4 stocks tend to follow the general direction of the broader market averages. Such is the case, even while the number of top-rated funds owning BIDU's shares rose from 112 in Sept '08 to 159 in Jun '09, clear evidence its shares were being accumulated. An earlier FSU appearance described some of the more extensive prior coverage this Chinese Internet search provider has received (read here).
http://factbasedinvesting.com/
