Tuesday, September 08, 2009 - CANSLIM.net
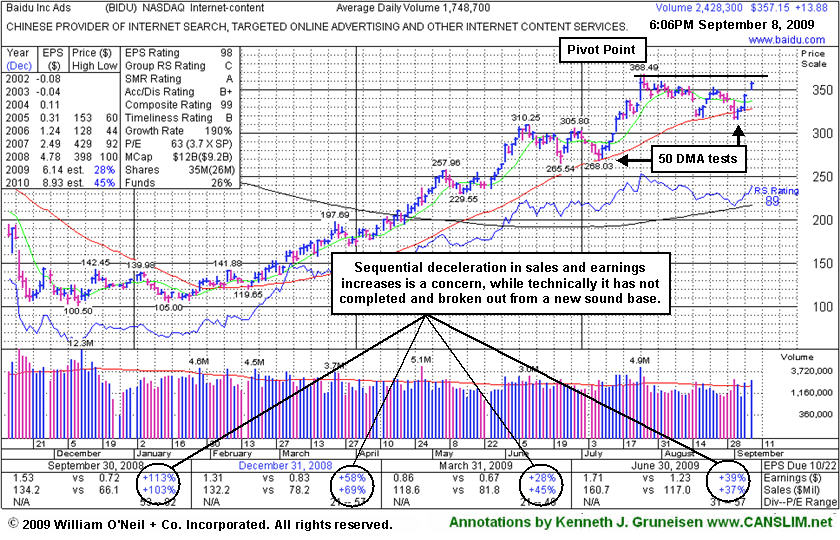
Baidu.com, Inc. (BIDU +$13.88 or +3.89% to $357.15) gapped up today and was featured in yellow in the mid-day report with new pivot point and max buy levels cited (read here). It is setting up on the right side of a near 6-week flat base while rising toward its 52 week high after its latest test of support at its 50-day moving average (DMA) line. That important short-term average line acted as firm support in July. The latest consolidation is shorter than the minimum 8-week length of a proper "double bottom" pattern. This high-ranked leader has a solid quarterly and annual earnings history, but its clear sequential deceleration in its increases is a concern which has been cited in recent reports. It could deserve the benefit of the doubt is a fresh technical buy signal is triggered. Remember that the investment system's guidelines require for a proper technical breakout to rise above its pivot point with heavy volume that is a minimum of +50% above average, preferably much more.
Based on weak technical action it was dropped from the Featured Stocks list on 1/11/08, when it was trading at $329, and it has rebounded very impressively from its January 2009 lows near $100. An annotated graph showed a vivid picture of the stock's weakness then under the headline, "Weakness Hurting Chances For Featured Favorite" (read here). Take a look back at that now! BIDU had rallied +356% since it first featured on Monday, October 30, 2006 in the CANSLIM.net Mid Day Breakouts Report (read here) with a $94.05 pivot point. Along the way it went through a multi-month consolidation under its 50 and 20 DMA lines, then later returned as a noteworthy leader featured in CANSLIM.net reports." Remember that a dropped stock can be featured again in a future CANSLIM.net report if it repairs its technical damage and forms a new pivot point. After its initial appearance, in fact, BIDU was featured again in yellow at $225.58 in the 09/11/07 CANSLIM.net Mid-Day BreakOuts Report as it was hitting new highs from an 8-week base period (read here). It may have looked "expensive" then, yet it subsequently zoomed to $429 by November of that year before beginning a very deep consolidation (coupled with a Bear Market).
http://factbasedinvesting.com/
