Friday, November 07, 2008 - CANSLIM.net
A very important technical tool that savvy investors have learned to incorporate in their technical analysis is the 200-day moving average (DMA) line. The 200 DMA line plays a pivotal role relative to a stock's price, and institutional investors (which concerns the I criteria) often support a stock they already own an interest in by buying more shares when that stock falls near its long-term average. When they do not step up and show support, a stock's deterioration below its 200 DMA can considered a technical sell signal. When a technical breakdown or violation takes place on heavy volume, it raises more serious concerns that large influential investors are rushing for the exits.
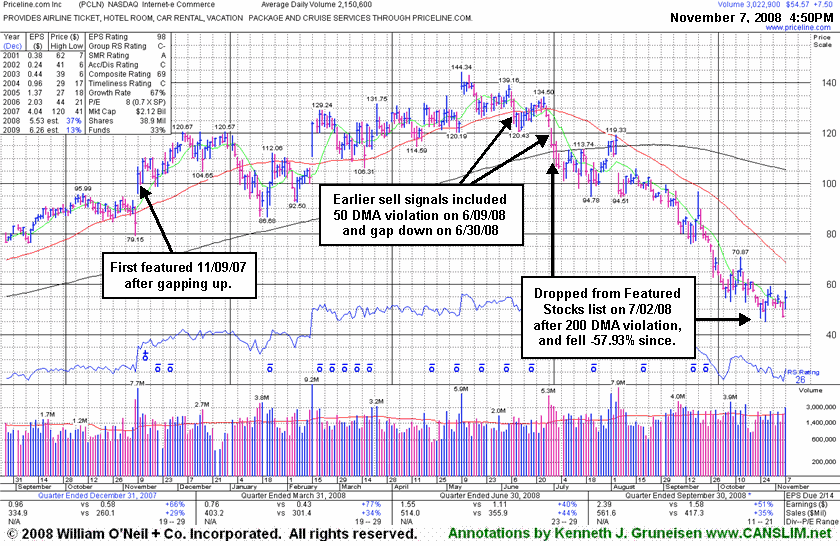
Priceline.com Inc. (PCLN +$7.50 or +15.93% to $54.57) is not a currently featured stock, however it may be worth another look at this Internet - eCommerce firm for any important lessons that can be learned from a previous market leader that has flashed multiple technical sell signals including a 200 DMA violation with losses on heavy volume. It was among the stronger performing issues in the first half of the year, however on June 9, 2008 the stock was noted in the CANSLIM.net After-Market Update as follows - "Loss today on near average volume, violating support at its 50 DMA line and an upward trendline while also falling under its pivot point, raising concerns" (read here). The stock formed a worrisome series of lower highs and on June 30, 2008 the stock was noted in the CANSLIM.net After-Market Update as follows - "Gapped down today and violated its recent chart lows in the $120 area, triggering another technical sell signal. The next key support level is its 200 DMA line (now $112.54) which closely coincides with an upward trendline" (read here). Technical sell signals were flashed again, and PCLN was dropped from the Featured Stocks list after its 200 DMA violation on July 2, 2008 (read here). It has fallen -57.93% since. PCLN was first featured on Friday, November 09, 2007 in the CANSLIM.net Mid Day Breakouts Report after gapping up over the $100 threshold (read here).
C A N S L I M | StockTalk | News | Chart | SEC | Zacks Reports | ![]()
![]()
![]()
http://factbasedinvesting.com/
