Monday, October 31, 2005 - CANSLIM.net
|
Ticker Symbol: AET |
Industry Group: Medical-hlth Maint Org |
Shares Outstanding: 290.0 Million |
|
Price: $88.56 (10/31/2005 close) |
Day's Volume: 2,788,100 (10/31/05 close) |
Shares in Float: 281.3 Million |
|
52 Week High: $89.20 |
50-Day Average Volume: 1,851,200 |
Up/Down Volume Ratio: 1.3 |
|
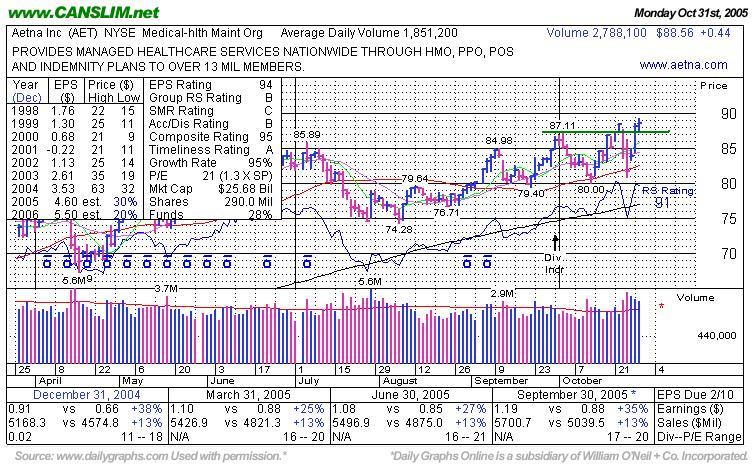
Pivot Point: $87.21 (10/04/05 high +$0.10) |
Pivot Point +5% = Max Buy Price: $91.57 |
Web Address: www.aetna.com |
C A N S L I M, StockTalk, News, Chart, SEC, Zacks Reports
CANSLIM.net Profile: Aetna, Inc. provides health care, dental, pharmacy, group life, disability, and long-term care benefits in the United States. It operates in three segments: Health Care, Group Insurance, and Large Case Pensions. The company's health and dental plans are offered on a risk basis and on an employer-funded basis. It provides medical and dental benefit products, including health maintenance organization, point-of-service, preferred provider organization, and indemnity benefit products. These products have helped the company enjoy solid earnings growth over the past three years, and at least +25% increases in the four prior quarterly earnings comparisons which help this issue meet the "C" and "A" criteria. It also provides specialty products, such as pharmacy benefits management, dental, vision, and behavioral health programs. Further, this segment provides access to network of independent dental and vision participating providers through its Vital Savings by Aetna discount program. The Group Insurance segment offers life, disability, and long-term care insurance products. The firm is the best ranked candidate in the Medical-Hlth Maint Org Group, a group now ranked 75th on the 197 Industry Groups list, but a group in the top quartile would be better at helping this selection meet the “L” criteria. Note, its low Return on Equity of 13% also falls a bit under the +17% guideline. However, the number of top-rated funds owning an interest has steadiliy increased from 538 in December '04 to 598 as of September '05, which is a very good indication as to the favorable meeting of the "I" criteria.
What to Look For and What to Look Out For: Featured in today's Mid-Day Breakouts Report (read here), this selection hit new all-time highs and is still under its maximum buy price. Currently trading above its pivot point of $87.21, it would be disconcerting to see it trade back below that level. If such losses were to occur, then its bullish breakout would be negated, giving cause for concern. In the past couple of months its 50 DMA has acted as chart support, and a violation of that short-term average would be a technical sell signal. If the issue continues advancing and trades above its pivot point by more than +5%, rising above what is considered as the "maximum buy price", then investors must be careful not to chase it because past that guideline risk increases. As always, stop losses should be placed 7-8% below your entry point to preserve capital.
Technical Analysis: An earlier breakout attempt lacked volume conviction, but on October 28th, 2005 the stock blasted above its pivot point on more than +3 times average turnover, clearing a more than 4-month base and all previous resistance. On October 31st the stock followed through and yet still closed below its maximum buy price, offering another buying opportunity. The bullish breakout on higher than average volume, coupled with the additional follow-through gains, prompted this issue to be highlighted in the coveted CANSLIM.net's Mid-Day Breakouts Report and to show up on the 52-week highs list.
http://factbasedinvesting.com/