Arcelor Mittal (MT)
Monday, June 23, 2008 CANSLIM.net

|
Arcelor Mittal (MT) |
|
|
Ticker Symbol: MT (NYSE) |
Industry Group: Steel- Producers |
Shares Outstanding: 1392 Million (1320 Mil) |
|
Price: $103.04 1:45 PM ET |
Day's Volume: 1,840,000 6/23/2008 1:45PM ET |
Shares in Float: 1307.0 Million |
|
52 Week High: $104.77 6/9/2008 |
50-Day Average Volume: 3,381,800 |
Up/Down Volume Ratio: 1.1 |
|
Pivot Point: $104.87 6/9/2008 high plus $0.10 |
Pivot Point +5% = Max Buy Price: $110.11 |
Web Address: http://www.arcelormittal.com
|
C A N S L I M | StockTalk | News | Chart | SEC | Zacks Reports

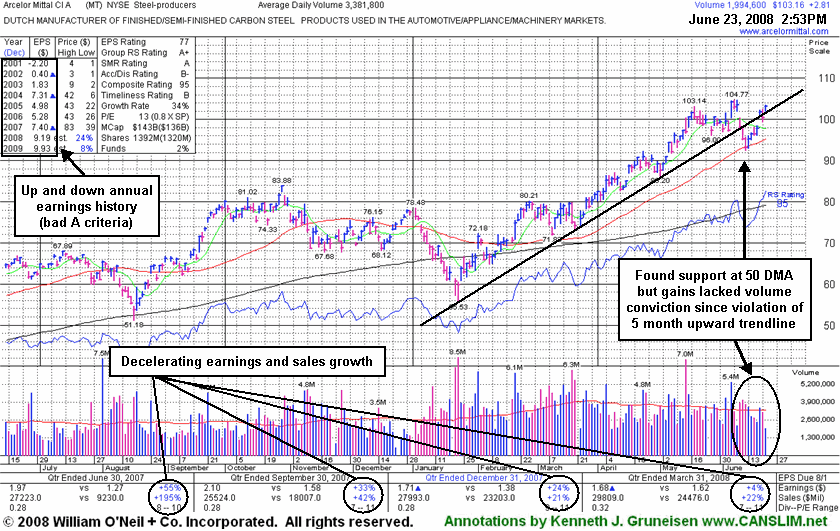
CANSLIM.net Company Profile: Arcelor Mittal engages in the production and marketing of steel worldwide. The company produces a range of finished and semi-finished carbon steel products. It primarily offers flat products, including sheet and plate; long products, including bars, rods, and structural shapes; and stainless steel products. The company serves various customer markets, including automotive, construction, household appliances, and packaging with sizeable captive supplies of raw materials and distribution networks. It was formerly known as Mittal Steel Company N.V. As of December 31, 2007, it had an annual production capacity of approximately 130 million tones of crude steel. The company was founded in 1989 and is headquartered in Luxembourg, Luxembourg. Arcelor sports an Earnings Per Share (EPS) rating of a 77 and a very healthy Relative Strength (RS) rating of 95. The company has an up and down annual earnings track record (bad A criteria) and there has been a deceleration in its sales revenues and earnings growth rate over the past 6 quarters. These are signs of weaker, not stronger fundamentals, raising some concerns. However, Return on Equity at +21% is encouragingly above the +17% guideline. MT resides in the Steel-Producers group which is currently ranked 3rd out of the 197 Industry Groups covered in the paper, placing it among high-ranked leaders in the much coveted top quartile (satisfying the L criteria).
What to Look For and What to Look Out For: The stock recently found support at its 50 DMA line for the first time since triggering its latest technical buy signal on April 4, 2008. Concerns would be raised by subsequent weakness leading to price deterioration is below its 50 DMA line, which then may act as resistance. It would be encouraging to see MT surge into new high territory on heavy volume after a sound follow-through day is produced by at least one of the major market averages. Disciplined investors would avoid chasing this issue above its maximum buy price of $110.11, where it would be too extended from a sound price base to be considered buyable under the proper guidelines. As always, it is of the utmost importance to sell a stock if it drops 7-8% below your purchase price. Typically, 3 out of 4 growth stocks will decline during market corrections, which creates ugly odds for the near term. The major averages are presently in a correction. New buying efforts are discouraged until a new rally is confirmed by at least one of the major averages producing a new follow-through day of at least +1.7% gains with heavier volume.
Technical Analysis: A sharp pullback with above average volume during the week ended 6/13/08 led to the violation of a 5 month upward trendline, which may be considered an early sign of deterioration in its previously strong upward trend. Technically, shares of MT can be accumulated between its 50 DMA line and its $110.11 maximum buy price after a new follow-through day is produced. The stock has performed very well over the past few months as the major averages have declined. This is best illustrated by the stock's 95 Relative Strength rating. A look at its weekly chart shows limited downward action with volume in recent months, as it has not encountered distributional pressure.