Gold Producer Demonstrating Strong Fundamentals and Technicals
Saturday, February 02, 2008 CANSLIM.net

|
Yumana Gold Inc. |
|
|
Ticker Symbol: AUY (AMEX) |
Industry Group: Metal- Ores Gold/Silver |
Shares Outstanding: 355,700,000 |
|
Price: $15.89 2/01/08 |
Day's Volume: 11,739,000 2/1/2008 |
Shares in Float: 352,200,000 |
|
52 Week High: $17.67 1/14/2008 |
50-Day Average Volume: 10,342,400 |
Up/Down Volume Ratio: 1.2 |
|
Pivot Point: 15.98 11/7/07 high plus $0.10 |
Pivot Point +5% = Max Buy Price: $16.78 |
Web Address: http://www.yamana.com
|
C A N S L I M | StockTalk | News | Chart | SEC | Zacks Reports |   

View all notes | Alert me of new notes | CANSLIM.net Company Profile
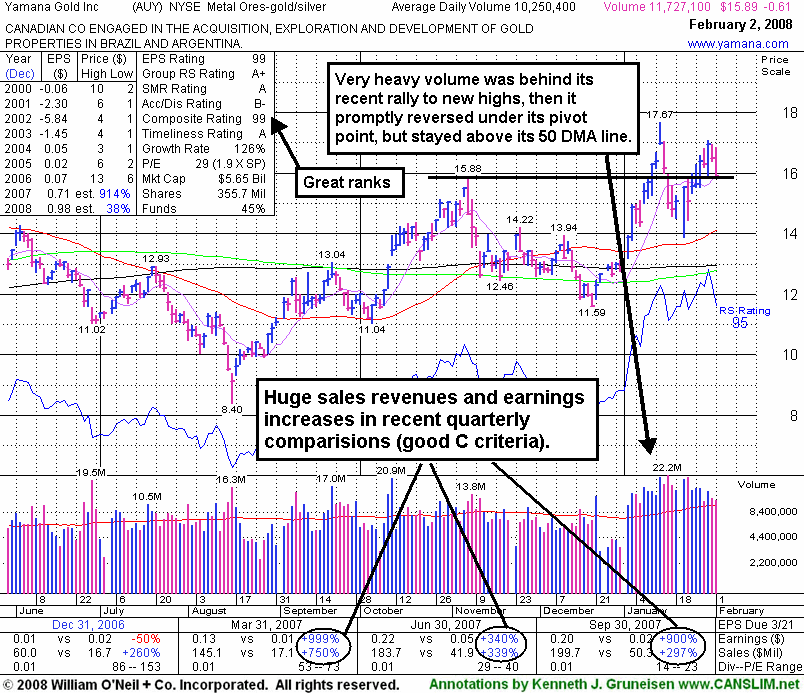
CANSLIM.net Profile: Yamana Gold, Inc. engages in the acquisition, financing, exploration, development, and operation of precious metal mining properties in Brazil, Argentina, Honduras, and Nicaragua. It primarily produces gold. The company owns, or holds interests in, and/or operates various properties principally comprising the Sao Francisco, Sao Vicente, and Fazenda Nova/Lavrinha properties, as well as the Chapada copper-gold project, the Fazenda Brasileiro gold mines, and the Jacobina gold mine in Brazil. It also owns or holds interests in the San Andres gold mine and prospective exploration grounds in Honduras, the Gualcamayo gold project in Argentina, and prospective exploration concessions in Nicaragua. Yamana Gold was founded in 1980 and is headquartered in Toronto, Canada. It was formerly known as Yamana Resources, Inc. and changed its name to Yamana Gold, Inc. in 2003. It hails from the Metal Ores - gold/silver group which is presently ranked 2nd on the 197 Industry Groups list, which easily satisfies the L criteria.The number of top-rated funds with an ownership interest has grown from 114 funds in March ‘07 to 197 funds as of December '07, a sign of increasing institutional interest (the I criteria). Strong quarterly earnings and sales revenues increases in recent quarters have been well above the +25% guideline to satisfy the C criteria.
What to Look For and What to Look Out For: Look for the stock to confirm a new technical buy signal by breaking out above its $15.98 pivot point with gains on heavy volume in the coming days and weeks. Remember that buyable breakouts require three important components: the stock must clear its pivot point with considerable gains, those gains must be backed by at least +50% above average volume, and the overall market environment must also be healthy. Much of AUY's success will depend on the broader market's ability to sustain a meaningful rally, otherwise 3 out of 4 stocks are likely to struggle. Deterioration under its most recent chart lows or its 50 DMA line (in the $14 area) would raise concerns and trigger technical sell signals. Going forward there are two things one should look for: the market should stage a powerful follow-through day and this stock should surge above its pivot point on enough volume to trigger a technical buy signal. It would be even better to see the stock claim a new all-time high close with gains backed by very heavy volume indicative of institutional buying demand.
Technical Analysis: In mid-January the stock broke out to new highs but volume was just under the necessary threshold needed to trigger a technical buy signal (January 10, 2008). Volume behind its gains did not surpass the necessary threshold until January 14, 2008, however, the stock was already trading above its maximum buy price and was considered too extended under the proper guidelines to be accumulated. Also, the market was in a correction which is not an environment conducive for success it one was considering accumulating shares. The prior breakout was promptly negated as high volume losses pressured it back into its prio base. It held up above its 50 DMA line and is currently trading near its pivot point and near its prior (Feb, Apr, & Nov 2007) chart highs.
|
 |
About :
Kenneth J. Gruneisen - Passed the CAN SLIM® Master's Exam
Kenneth J. Gruneisen started out as a licensed stockbroker in August 1987, a couple of months prior to the historic stock market crash that took the Dow Jones Industrial Average down -22.6% in a single day. He has published daily fact-based fundamental and technical analysis on high-ranked stocks online for two decades. Through FACTBASEDINVESTING.COM, Kenneth provides educational articles, news, market commentary, and other information regarding proven investment systems that work in good times and bad.
Comments contained in the body of this report are technical opinions only and are not necessarily those of Gruneisen Growth Corp. The material herein has been obtained from sources believed to be reliable and accurate, however, its accuracy and completeness cannot be guaranteed. Our firm, employees, and customers may effect transactions, including transactions contrary to any recommendation herein, or have positions in the securities mentioned herein or options with respect thereto. Any recommendation contained in this report may not be suitable for all investors and it is not to be deemed an offer or solicitation on our part with respect to the purchase or sale of any securities.
You can contact Kenneth J. Gruneisen - Passed the CAN SLIM® Master's Exam at kengruneisen@gmail.com

|
|
The information
and writings made
avaialable by individuals that successfully passed the CAN SLIM®
Masters Program are their own. Copyright © 1996-2025
Gruneisen Growth Corp. All rights reserved. Protected by the
copyright laws of the United States and Canada and by international
treaties.
|
|
|
|
|