CANSLIM.net Profile: China Medical Technologies, Inc., through its subsidiaries, develops, manufactures, and markets medical devices for the treatment of solid cancers and benign tumors in the People's Republic of China. It offers the HIFU therapy system, an ultrasound-guided ablation system that is used for the non-invasive treatment of liver, breast, and kidney tumors; solid tumors in the pelvic cavity or on bone; and tumors in the four limbs or superficial tissues. The company also develops an integrated luminescence immunoassay IVD system, ECLIA system, using ECLIA technology to detect and monitor various diseases and disorders through laboratory evaluation and analysis of blood, urine, or other body fluids. China Medical Technologies offers approximately 56 types of reagent kits for use with its ECLIA analyzer to detect various thyroid disorders, diabetes, hepatitis, disorders related to reproduction and growth, and various types of tumors, as well as to assess the effect of digoxin, a drug used for the treatment of heart failure. It sells its products through distributors. The company was founded in 1999 and is based in Beijing, the People's Republic of China. The company sports a very healthy Earnings Per Share (EPS) rating of 98 and a strong Relative Strength (RS) rating of 96. Return on Equity of 23% is above the 17% guideline. The company has managed to increase its earnings by well above the +25% guideline in each of the past four quarterly comparisons versus the year earlier (satisfying the C criteria) and its annual earnings history (the A) is good . CMED resides in the Medical - systems/equip group which is currently ranked 7th of out the 197 Industry Groups covered in the paper, placing it in the much preferred top quartile. This helps satisfy the L criteria of it being a leading company in a leading industry group. Management owns about 26% of its shares, which provides great motivation to protect and build shareholder value.
What to Look For and What to Look Out For: Since CMED has already risen above its pivot point with gains backed by the necessary volume to trigger a proper technical buy signal, it would be very encouraging to see this high ranked leader continue rallying above its maximum buy price of $39.53. There may be a little resistance remaining due to overhead supply up until it clears its February 2006 chart high in the $44 area. Meanwhile, any breakdown into its prior base leading to a close back under its July 23rd high close of $35.95 would raise comcerns as it would technically negate the latest breakout. Its 50-day moving average (DMA) line would then be the next nearby support level of importance chart-wise, where violations could trigger technical sell signals. Avoid chasing it above its maximum buy price of $39.53, where it would be too extended from a sound price base. As always, it is of the utmost importance to sell a stock if it drops 7-8% below your purchase price. The small supply of outstanding shares could lead to dramatic price volatility, especially if the institutional crowd rushes in or out.
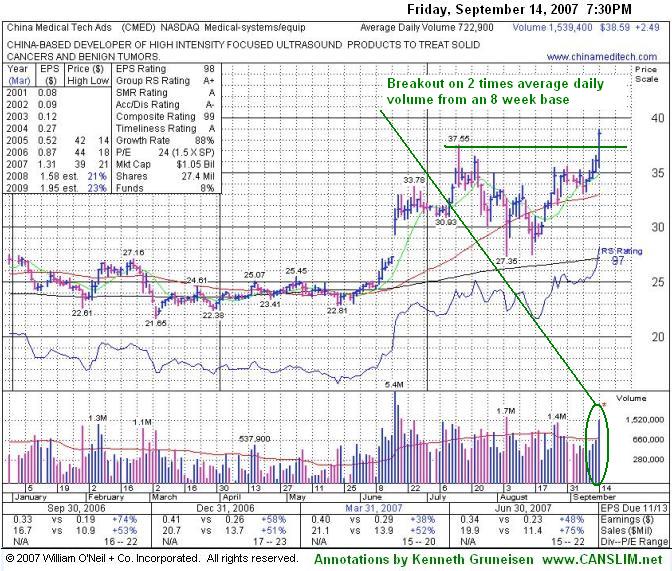
Technical Analysis: The stock triggered a technical buy signal on Friday September 14, 2007 when it jumped above its $37.65 pivot point on nearly two times average volume. It closed at a new 52-week high with no resistance remaining due to overhead supply, which suggests that further gains are likely. Its weekly chart features several up weeks on heavier than average volume versus only one down week on heavy volume, which is a very bullish sign. MEAS may also face some resistance due to overhead supply from earlier highs near $44 in February of 2006.

 Get
a Free 14 Day All Access Trial
Get
a Free 14 Day All Access Trial