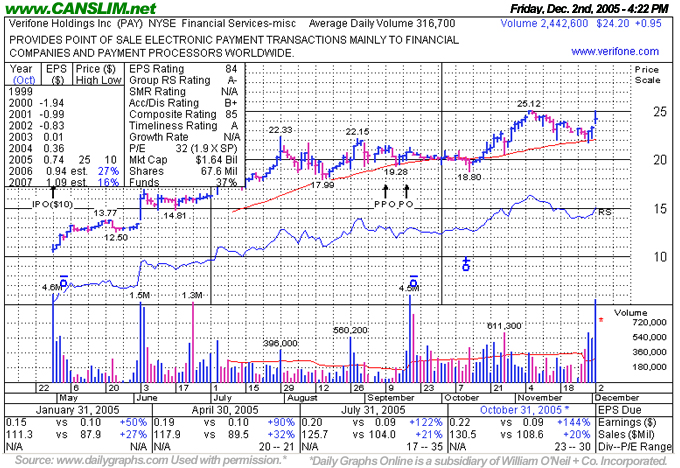
CANSLIM.net Company Profile: VeriFone Holdings, Inc. (PAY) engages in the design, marketing, and service of transaction automation systems that enable secure electronic payments among consumers, merchants, and financial institutions. On December 1st the company reported fourth quarter net income of $12.1 million, or $0.18 per share compared to the year-ago earnings of $2.8 million, or $0.05 per share. Aided by a 34% increase in international business and a 13% rise in North America business, revenues climbed 20% to $130.5 million, surpassing analysts’ consensus of $126.5 million in sales. The company is a member of the highly-ranked Financial Services-Miscellaneous group, which is rated 39th out of 197 industry groups for relative price performance, improved 14 notches during the past three months. Institutional sponsorship has been on the rise as well, with the shareholder base witnessing an increase from 79 to 108 top-rated institutions over the Dec '04 to Sep '05 period, contributing to a net increase of nearly 11 million shares into the hands of institutional investors.
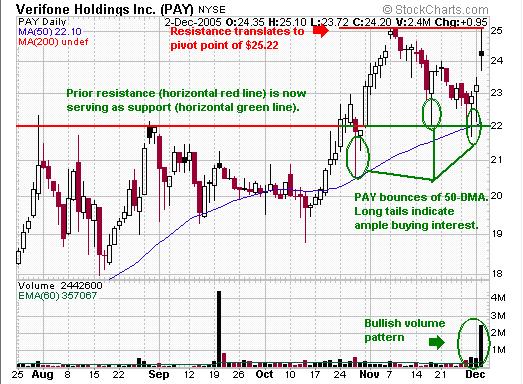
What to Look For and What to Look Out For: There still is arguably a need to be patient. The stock's inability to overtake resistance at the $25.12 mark would for the time be a concern. We have reminded investors from time-to-time not to buy in anticipation of breakouts, as it is proper to wait for a stock to prove itself. Look for a move above $25.22 on a minimumm of +50% above average volume to offer a new technical buy signal. The December 2nd gap up created a "rising window" that should meanwhile provide a layer of support, with the recent chart lows and 50-day moving average (DMA) line as the next important support levels. (Editor's Note: Read Frank Testa's article from the November '05 CANSLIM.net News for a candlestick charting example of the role a “rising window” plays on pullbacks. Read here).
Technical Analysis: In late October the stock went on a nine session winning streak leading to the shares' break above the $22 resistance level at prior chart highs. It breifly retested the 50-day moving average (DMA) line and found support before then rallying to $25.12. It has recently pulled back to a successful test prior resistance, with every losing session in November marked by lighter than average volume except one. In textbook fashion, prior resistance is now serving as current support. In addition, the stock has bounced off its upward sloping 50 DMA line with gains on above average volume. Strong fourth quarter earnings announced after the close on December 1st served as the catalyst for a bullish gap on December 2nd as the stock opened at $24.35, quickly rallying to $25.10 (just short of its $25.22 pivot point) before it reversed to close below the middle of the day’s trading range at $24.20. Volume swelled to 2.4 million shares, or more than 7 times its average daily turnover. That bullish gap up could be considered an early technical buy signal, as gaps up within a stock's base are considered to be a positive indication of strong institutional buying demand. In candlestick terminology, a series of long tails (wide trading range whereby a stock closes within the upper band of the day’s range) indicate that ample buying interest showed up promptly on the recent pullbacks.

 Get
a Free 14 Day All Access Trial
Get
a Free 14 Day All Access Trial