|
 STOCK BULLETIN STOCK BULLETIN
"Since 1996, Providing Essential Services for the CANSLIM(TM) Investor"
|
Tuesday, Nov. 22nd 2005 | 4:15 PM
|
|
Comtech Telecommunications Corp. |
- Frank E. Testa, CANSLIM.net Contributor |
|
Ticker Symbol: CMTL (NASDAQ) |
Industry Group: Communication Equipment |
Shares Outstanding: 22,700,000 |
|
Price: $44.05 9:45AM ET |
Day's Volume: 61,137 11/22/2005 9:45AM ET |
Shares in Float: 21,500,000 |
|
52 Week High: $44.45 11/22/2005 9:45AM ET |
50-Day Average Volume: 500,900 |
Up/Down Volume Ratio: 1.6 |
|
Pivot Point: $43.46 (10/04/05 high +$0.10) |
Pivot Point +5% = Max Buy Price: $45.63 |
Web Address: http://www.comtechtel.com/ |
C A N S L I M | StockTalk | News | Chart | SEC | Zacks Reports
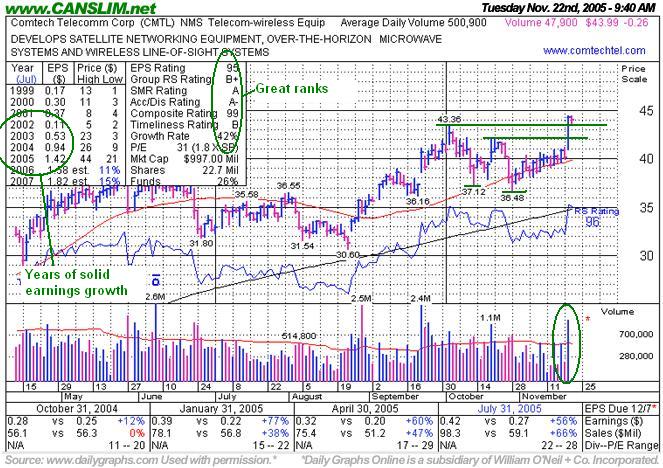
CANSLIM.net Profile: Comtech Telecommunications Corp. (CMTL) engages in the design, development, production, and marketing of products, systems, and services for communications solutions. The company operates through three segments: Telecommunications Transmission, Mobile Data Communications, and RF Microwave Amplifiers. CMTL has achieved stellar quarterly earnings growth and demonstrated annual earnings consistency, thereby meeting the “C” and “A” criteria. Institutional sponsorship has increased from 79 to 100 top-rated funds with an ownership interest from Dec '04 to Sept '05, thus satisfying the “S” and "I" criteria. The company is a high-ranked leader in the Telecom-Wireless Equipment group which presently is ranked 53rd on the 197 industry groups list, hence meeting the “L” criteria.
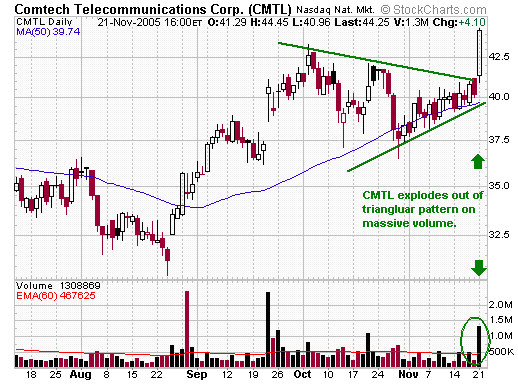
What to Look For and What to Look Out For: After a considerable gain on November 21st, CMTL may be prone to a pullback as momentum players may be tempted to take profits ahead of the Thanksgiving holiday. A retracement on light volume may present an attractive entry point. Violation of the November 21st low would certainly be cause for concern, although the 50-day moving average (DMA) line has served as solid support since late October. The 50 DMA currently resides about 10% below the stock’s price, or 2%-3% more than the recommended 7%-8% guideline for cutting losses properly. One way to combat this problem is to demonstrate patience and wait for a retracement or pullback in the stock back down toward support near prior chart highs, but in doing so you run the risk of missing an ideal entry point should CMTL continue its advance.
Technical Analysis: On November 21st, shares of CMTL emerged out of an 8-week flat base on top of a prior base pattern. This action prompted it to again be featured in yellow in CANSLIM.net's Mid-Day BreakOuts Report (read here). The breakout came with volume nearly three times its average daily volume, and the stock vaulted past its pivot point of $43.46. A more conservative analysis might be to consider it a "double bottom" pattern, where the pivot point (at the center of the "W" formed) would be the October 20th high of $42.10, and to stick within 5% of it an investor would pay no more than $44.20. Technically, another bullish sign has been the stock’s relative strength line hitting new highs, providing confirmation that the stock is a market leader. It showed up in CANSLIM.net's Mid-Day BreakOuts Report on September 22nd when there was a bullish gap up to new all-time highs (read here). It continued to as high as $43.36 intra-day on October 4th before pulling back while the sell-off in the overall market weighed on the issue. It spent three weeks hugging its 50 DMA line during which time the volume was light on down days. (read here)
Chart courtesy www.stockcharts.com
This report is now PRINTABLE as an Adobe PDF file here. To read a PDF file, you will need the latest version of the Adobe Acrobat Reader if it is not already installed on your computer. Download the free Adobe Acrobat Reader from www.adobe.com.

 Frank E. Testa is a Chartered Market Technician (CMT) and a member of the Market Technicians Association (MTA). Frank is a Vice President and Chief Technical Analyst at CapitalBridge and a devoted practitioner of the CAN SLIM investing methodology. Frank’s work has been published in several periodicals and his Power Point and Figure Charting Method will appear in the upcoming Journal of Technical Analysis. In addition, Frank has successfully obtained the Series 7 Registered Representative License and Series 63 License. Frank can be reached at fjkltesta@verizon.net. Frank E. Testa is a Chartered Market Technician (CMT) and a member of the Market Technicians Association (MTA). Frank is a Vice President and Chief Technical Analyst at CapitalBridge and a devoted practitioner of the CAN SLIM investing methodology. Frank’s work has been published in several periodicals and his Power Point and Figure Charting Method will appear in the upcoming Journal of Technical Analysis. In addition, Frank has successfully obtained the Series 7 Registered Representative License and Series 63 License. Frank can be reached at fjkltesta@verizon.net.
Comments contained in the body of this report are technical opinions only. The material herein has been obtained from sources believed to be reliable and accurate, however, its accuracy and completeness cannot be guaranteed. Our firm, employees, and customers may effect transactions, including transactions contrary to any recommendation herein, or have positions in the securities mentioned herein or options with respect thereto. Any recommendation contained in this report may not be suitable for all investors and it is not to be deemed an offer or solicitation on our part with respect to the purchase or sale of any securities.
We are interested in hearing your feedback. Direct your questions or comments to jamest@canslim.net. More information on any issues is available by request, just call 1-888-CAN-SLIM. Information contained herein is believed accurate but not warranted. www.CANSLIM.net is not an investment advisor, hence it does not endorse or recommend any securities or other investments. Any recommendation contained in this report may not be suitable for all investors and it is not to be deemed an offer or solicitation on our part with respect to the purchase or sale of any securities.
Copyright © 1996-2005 Gruneisen Growth Corp. d/b/a www.canslim.net All rights reserved.
Protected by the copyright laws of the United States and Canada and by international treaties.
The names "CANSLIM" and "CAN SLIM" are service marks and trade names of Data Analysis, Inc., a California corporation, and are used by Gruneisen Growth Corp., a Florida corporation, under license. GGC is solely responsible for the operation of and opinions expressed in this Website.
Privacy Policy | Terms of Use | Contact Us |
|

 Get
a Free 14 Day All Access Trial
Get
a Free 14 Day All Access Trial